Table of Contents
Radio engineers live in a world where uptime is everything. A transmitter drops, a microwave link goes dark, or a firewall port gets blocked—and too often you only find out when the audience notices.
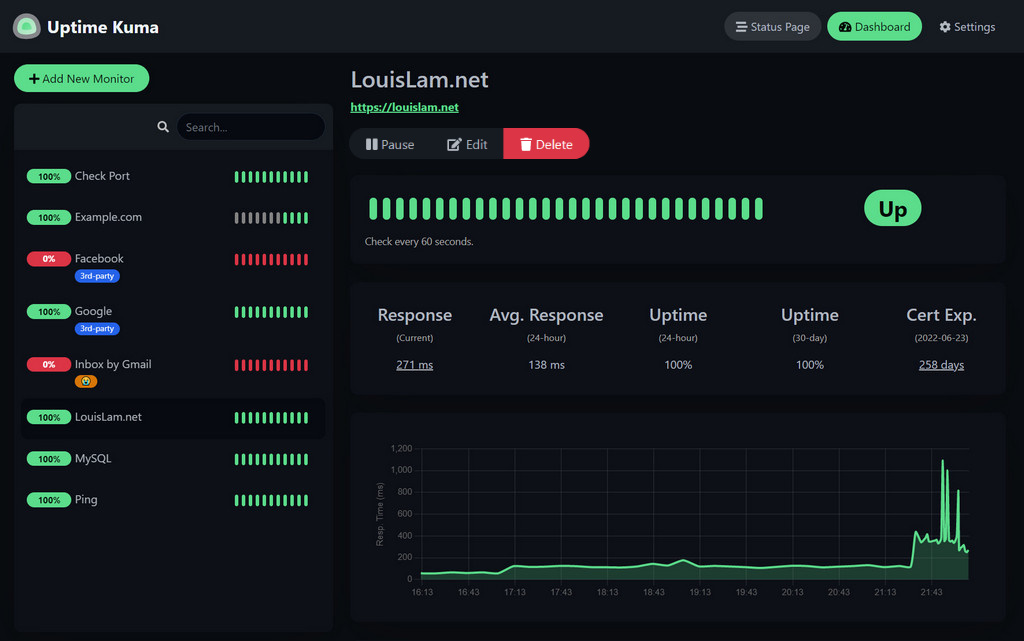
A while back, I wrote about Uptime Kuma for radio stations and why it’s such a valuable tool for broadcast engineers. That post sparked a lot of interest, and many of you reached out asking for a step-by-step guide to actually get it running in your plant. That’s what this post is all about: a practical walkthrough for installing Uptime Kuma with Docker and setting it up to monitor the infrastructure that keeps your station alive.
Uptime Kuma is an open-source uptime monitoring system. It runs in Docker and gives you a modern, responsive dashboard for keeping tabs on anything with an IP address. Originally built for IT systems, it’s a natural fit for broadcast engineering: transmitters, STL links, site circuits, workstations, firewall ports, and even DNS records.
At Fully Modulated, we’re big fans of tools that keep stations on the air without breaking budgets. Kuma is one of the most effective options out there.
Why Uptime Kuma for Radio Engineers?
Traditional broadcast monitoring often depends on expensive telemetry gear and SNMP traps. Kuma takes a simpler, more flexible approach:
- Ping (ICMP): confirms devices are reachable.
- HTTP/HTTPS: ensures web interfaces or stream URLs are live.
- TCP Ports: checks services like codecs, VPN tunnels, or firewall rules.
- DNS Records: verifies your website, streaming domains, and mail servers resolve correctly.
And here’s the bigger picture: more and more of our broadcast infrastructure, audio plants, and transmitter sites are becoming IP-driven. The STL might ride on microwave IP, transmitters are managed through web consoles, and even your automation system is tied into IP networks.
That’s where Kuma shines. Fire up a small Ubuntu VM, or a Raspberry Pi running Docker, and within minutes you’ve got a monitoring system designed for today’s broadcast reality.
Step-by-Step: Installing Uptime Kuma with Docker
1. Install Docker
On Ubuntu/Debian:
sudo apt update
sudo apt install -y docker.io
Verify installation:
docker --version
2. Run Kuma in Docker
sudo docker run -d --restart=always -p 3001:3001 -v uptime-kuma:/app/data --name uptime-kuma louislam/uptime-kuma:1
-p 3001:3001maps port 3001 to the host.-v uptime-kuma:/app/datakeeps your data persistent.--restart=alwaysensures it restarts on boot.
Check status:
docker ps
3. Access the Web UI
In your browser:
http://<server-ip>:3001
On first launch you’ll create an admin account.
Adding Monitors in Uptime Kuma
Click Add New Monitor and choose a type.
-
ICMP (Ping) Ideal for transmitters, STL radios, routers, or workstations.
-
HTTP/HTTPS
Perfect for stream URLs, transmitter web interfaces, or automation dashboards. -
TCP Port
Confirm that firewall rules or codec ports are open and listening.
Keyword Checks for Web Interfaces
Some broadcast devices don’t even respond to pings. For example, the Omnia.9 audio processor blocks ICMP entirely. But Kuma lets you go one step further with keyword checks on HTTP/HTTPS monitors.
When adding a monitor:
- Set Monitor Type to
HTTP(s). - Enter the device’s web UI address, for example:
http://IP-ADDRESS:7380
- Add the Keyword field and set it to:
Omnia.9
Now Kuma will load the page and confirm that the keyword is present. If it finds it, the device reports as OK. If the keyword is missing—or the page doesn’t load—you’ll get an alert.
DNS Monitoring
Kuma can also check DNS records. This is huge for broadcasters, since a misconfigured record can knock listeners offline or break email overnight.
You can monitor:
- A/AAAA records for your station’s website or streaming domains.
- CNAMEs for subdomains like
stream.mystation.com. - MX records for email delivery reliability.
- TXT records for SPF/DKIM entries.
If any of these records change unexpectedly—or stop resolving—Kuma alerts you immediately. That means you’ll know about DNS problems before they impact streaming revenue, website traffic, or critical business email.
Status Pages and Incident Reports
Kuma can generate status pages that are more than just a dashboard for engineers:
- Group all monitors for a site (e.g., “TX Site A”) into one public-facing page.
- Share these pages with station staff so they can check system status before ringing your phone.
Incident Reports on Status Pages
One powerful feature: you can post your own incident reports directly on a status page.
If you already know the transmitter STL is down and you’re driving to the site, you can log an incident in Kuma. Staff checking the page will see your note and know you’re on it.
This simple workflow reduces unnecessary calls and gives management visibility while you stay in control of the narrative.
Notifications: Beyond Email
Uptime Kuma supports far more than email alerts. Its notification system includes dozens of integrations:
- Chat & Collaboration: Slack, Microsoft Teams, Discord, Mattermost, Telegram, Google Chat, Rocket.Chat, Zulip
- Incident & Ticketing: PagerDuty, OpsGenie, ServiceNow
- Push Notifications: Pushover, Gotify, Pushbullet, Bark, ntfy
- Messaging APIs: Twilio (SMS), Signal, WhatsApp via gateways
- Webhooks: Custom integrations into scripts, automation, or internal systems
- Others: Email (SMTP), Matrix, LINE, WeCom, and more
For a radio engineer, this means:
- A Slack alert goes to #engineering the second your STL link fails.
- A Teams webhook updates management when the transmitter drops.
- A PagerDuty alert wakes the on-call engineer at 2am.
- A custom webhook could even trigger a mute/unmute script in your automation system.
You can assign different notification methods per monitor. For example, a workstation ping might just email you, but a transmitter outage could blast Slack, Teams, and PagerDuty all at once.
Security Best Practices
If your Kuma dashboard will be exposed beyond your LAN:
- Run it behind a reverse proxy (like Nginx or Traefik) with Let’s Encrypt.
- Enable two-factor authentication in settings.
- Restrict access with firewall rules or a VPN.
- Keep Docker and Kuma updated regularly.
Wrapping Up
For almost zero cost, radio engineers can gain modern uptime monitoring. Uptime Kuma is lightweight, reliable, and designed to notify you before listeners hear silence.
With keyword monitoring for devices like the Omnia.9, DNS checks to keep tabs on your domains, status pages with incident reports to keep staff informed, and powerful integrations for Slack, Teams, PagerDuty, and more, Kuma isn’t just a monitor—it’s a communication hub for your entire broadcast operation.
Fire up a VM or a Raspberry Pi, drop in Docker, and in under an hour you’ll have one of the most useful broadcast tools you’ve ever deployed.
Want more broadcast-engineering tools like this? Check out my earlier article on Uptime Kuma for radio stations, or dive deeper into related topics on the Fully Modulated podcast episodes.
Have you tried Uptime Kuma at your site? Share your setup in the comments!


Get On The Air